
Data is the difference between an SEO report that gets filed and one that gets acted on. Without it, you’re presenting activity. With it, you’re presenting evidence. The role of data in SEO reporting is to translate organic search performance into business language, connecting rankings and traffic to revenue, leads, and pipeline in ways that executives actually care about. Done right, data-driven SEO reporting doesn’t just prove that SEO is working. It proves why the business should keep investing in it.
The core problem most SEO teams face isn’t a lack of data. It’s a lack of the right data, framed the right way, for the right audience. Google Analytics 4, Google Search Console, and rank tracking tools generate enormous volumes of information. But a significant portion of AI search citations come from the first 30% of a page, which means the same principle applies to reports: bury your most important findings and they won’t get read, let alone acted on.
Here’s what data does in an SEO report when it’s used well:
- Connects organic search outcomes to business metrics like revenue, leads, and cost-per-acquisition
- Separates signal from noise by filtering vanity metrics out of stakeholder-facing reports
- Provides the evidence base for strategic recommendations and budget justification
- Tracks progress against defined KPIs across business outcomes, visibility, site health, and efficiency
- Enables consistent, repeatable reporting through automation and normalized data sources
- Supports attribution modeling that captures organic search’s full contribution to conversions
- Gives executives a commercial baseline rather than a ranking scorecard
Table of Contents
- What types of SEO reports should you be producing?
- Which SEO metrics and KPIs actually belong in your reports?
- How do you collect accurate SEO data from the right sources?
- How should you structure SEO reports for different stakeholders?
- What role do Google Analytics and related tools play in SEO reporting?
- What are the best practices for SEO reporting that actually drives decisions?
- Advanced data-driven SEO reporting insights from Seotonic
- Key Takeaways
- FAQ
What types of SEO reports should you be producing?
An SEO report is a structured document that aggregates organic search performance data and connects it to business objectives. The key word is “structured.” A one-off analytics export is not a report. A report is repeatable, audience-specific, and built around a question the reader actually needs answered.
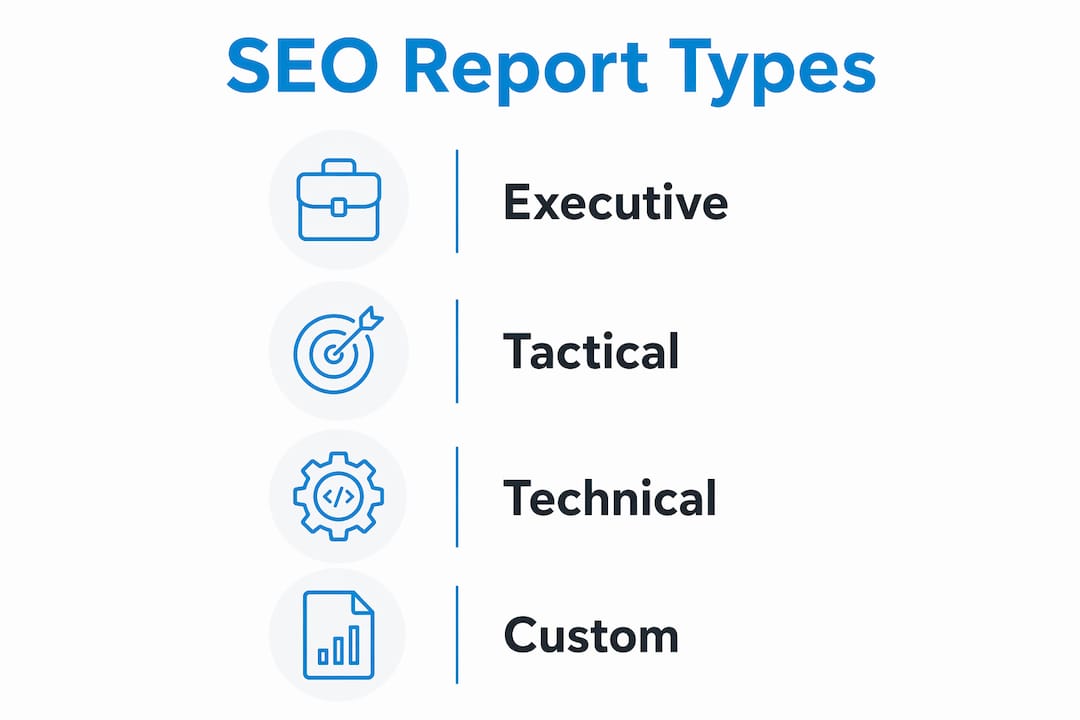
Most SEO teams produce several distinct report types, each serving a different purpose:
- Executive summary: A one-page, narrative-led document focused on organic revenue, lead volume, and market share. No keyword-level data, no domain authority scores. Quarterly cadence for most organizations.
- Operational dashboard: A live, comprehensive view designed for SEO and content teams. Alert-focused, updated weekly, and built to catch technical issues before they show up in monthly business numbers.
- Technical audit report: A deep-dive into crawl coverage, index ratio, Core Web Vitals, and site health. Produced after major site changes or on a quarterly basis.
- Campaign or content performance report: Tracks specific initiatives, keyword clusters, or content programs against defined targets. Useful for content teams and channel managers.
- Competitive analysis report: Monitors share of voice, SERP feature ownership, and competitor ranking movements. Typically monthly or quarterly.
The balance between narrative and raw data shifts depending on the audience. Executives need a story with numbers as supporting evidence. Technical teams need the numbers with enough context to act. Automation matters here too: repeatable, automated reports reduce human error and free analysts to spend time on interpretation rather than data extraction.
Which SEO metrics and KPIs actually belong in your reports?
The most common SEO reporting failure is leading with vanity metrics. Rankings, total keywords ranked, raw impressions, and domain authority scores are useful internally, but they don’t answer the question a CFO or marketing director is actually asking: what did SEO contribute to the business this quarter?

An SEO reporting framework organizes KPIs into business outcomes, visibility, site health, and efficiency tiers, each relevant to different audiences.
Executives care primarily about Tier 1. SEO teams need Tiers 2 through 4. Presenting Tier 4 data to a board is how SEO budgets get cut, not protected.
The discipline here is deliberate exclusion. If a metric can’t be traced back to a business goal, it doesn’t belong in a stakeholder report. Rankings still matter for the search team internally, but they shouldn’t headline a client or board presentation. The same logic applies to AI-driven traffic: tracking AI referral visits without tying them to conversions just creates a new vanity metric to replace the old ones.
Pro Tip: Before finalizing any stakeholder report, run a quick test: could your finance director read this without asking a follow-up question? If not, it needs another pass.
How do you collect accurate SEO data from the right sources?
Accurate SEO reporting depends on pulling data from multiple sources and reconciling them before you draw conclusions. No single platform gives you the full picture, and decisions made on incomplete data tend to be expensive ones.
The practical reporting stack for 2026 combines three free tools with one paid tool:
- Google Search Console: Impression, click, ranking, and crawl data directly from Google. The source of truth for Google’s view of your site, including Core Web Vitals and index coverage.
- Google Analytics 4: On-site user behavior, organic conversion attribution, revenue tracking, and referral source data including AI platform traffic.
- Google Looker Studio: Connects both into live dashboards with separate views per audience. Free, and powerful enough for most reporting needs.
- One paid tool (rank tracker or competitive intelligence platform): Adds competitive share-of-voice tracking, SERP feature ownership, and backlink authority data that Google’s own tools don’t provide.
- CRM platform: Closes the loop by connecting organic-attributed leads to pipeline and closed revenue. Without this, you’re missing the last mile of attribution.
Google Search Console and GA4 report session and click data differently due to their measurement methods. For reporting, use GA4 for conversion analysis and GSC for visibility and technical diagnostics.
Both quantitative data (traffic numbers, rankings, conversion rates) and qualitative data (user feedback, search intent patterns, content engagement signals) belong in a complete reporting picture. Quantitative data tells you what happened. Qualitative data helps explain why.

How should you structure SEO reports for different stakeholders?
Report structure is where most SEO teams lose their audience before the data even lands. The format, depth, and frequency of a report should match the decision timeline of the person reading it.
Aligning report cadence with stakeholder needs is a foundational principle: executives make strategic decisions quarterly and budget decisions annually, while operational teams act on technical issues weekly. Mismatching frequency and format trains your audience to ignore the report.
| Audience | Format | Cadence | Lead metric |
|---|---|---|---|
| C-suite / board | One-page executive summary | Quarterly | Organic revenue or leads |
| Marketing director | Narrative report with visuals | Monthly | Traffic cost-equivalent, conversion rate |
| SEO / content team | Operational dashboard | Weekly | Rankings, CTR, crawl health |
| Technical team | Technical audit report | Monthly or post-change | Core Web Vitals, index coverage |
A few structural principles that consistently improve how reports land:
- Lead with the business metric, not the SEO metric. Organic revenue or lead volume is the headline. Rankings and traffic explain why that business metric moved. They’re the mechanism, not the story.
- One insight per report. A report with one clear finding and one concrete recommendation gets acted on. A report with fourteen data points and no recommendation gets filed.
- Use data visualization deliberately. Charts and graphs should clarify a trend, not decorate a slide. A simple line chart showing organic revenue over 12 months communicates more than a table of weekly ranking changes.
- Keep executive reports to one page. No keyword-level data, no SEO jargon that requires prior knowledge to interpret.
- Put your most important finding in the first third of the report. Stakeholders skim, and the same principle that drives AI citation behavior applies to human readers.
What role do Google Analytics and related tools play in SEO reporting?
Google Analytics 4 is the core of any SEO reporting stack. It tracks on-site user behavior, organic conversion attribution, and revenue tracking from organic search, giving you the data to connect a keyword ranking to an actual sale. Without GA4, you can describe visibility. With it, you can describe impact.
Each tool in the stack plays a distinct role:
- Google Analytics 4: Tracks sessions, user behavior, conversion events, and revenue attribution by channel. The essential tool for connecting organic traffic to business outcomes. Handles AI platform referral traffic tracking as well.
- Google Search Console: Reports on search visibility, impressions, clicks, average position, and crawl health. Covers the pre-click experience that GA4 can’t see. Also provides the impression-to-click ratio data that proxies AI Overview coverage.
- Google Looker Studio: Consolidates GA4 and GSC data into live, shareable dashboards. Separate views for different audiences are easy to configure and keep reports audience-appropriate without duplicating work.
- Rank tracking tools: Add keyword-level position monitoring over time, competitive share-of-voice data, and SERP feature ownership tracking that neither Google tool provides natively.
- CRM platforms: Connect organic-attributed leads to pipeline and closed revenue, completing the attribution chain from first organic visit to closed deal.
Automation across this stack matters more than most teams realize. Manual reporting wastes a significant portion of analyst time on data preparation rather than interpretation. Automated data pulls from these tools, normalized and reconciled before they hit a dashboard, produce consistent and trusted insights that marketing and sales teams can rely on month after month.
Pro Tip: When GA4 and GSC show conflicting session and click numbers, don’t average them or pick one arbitrarily. Use GSC for visibility diagnostics and GA4 for conversion analysis. They measure different things, and treating them as interchangeable is one of the most common data errors in SEO reporting.
What are the best practices for SEO reporting that actually drives decisions?
The most common SEO reporting failure isn’t bad data. It’s presenting data without a narrative. A report full of charts and no story loses stakeholders. A report that leads with “organic revenue grew 18% this quarter, driven by three content initiatives” and then explains the mechanism keeps them engaged.
Core best practices that consistently improve report quality and stakeholder engagement:
- Lead with commercial outcomes. Restructure reports so organic revenue, lead volume, or traffic cost-equivalent appears first. Move rankings to an appendix.
- Write one clear recommendation per report. Tell the reader what happened, why it happened, and what to do next. Three prioritized recommendations with estimated impact outperform a data summary with no direction.
- Match report depth to audience. Executives need a concise narrative. Technical teams need granular data. Sending the same report to both wastes everyone’s time.
- Be transparent about attribution limitations. Attribution in search is rarely clean. A well-explained estimate that ties back to revenue is more useful than a precise figure nobody can interpret.
- Address traffic declines proactively. If organic traffic is down, flag it before a stakeholder notices it themselves. Proactive disclosure builds trust; waiting for someone else to spot it does the opposite.
- Phase in revenue-focused KPIs gradually. Introducing one or two revenue-led metrics alongside existing reports, then phasing out rankings as headline metrics over a quarter or two, tends to land better than changing everything at once.
- Avoid data overload. Including every available metric to prove thoroughness makes the report impossible to navigate. One insight, one recommendation, one clear action.
The framing of a report matters as much as the data inside it. Renaming a report from “SEO performance” to “Organic search contribution to new business” changes how a leadership team engages with it, even when the underlying data is identical.
Advanced data-driven SEO reporting insights from Seotonic
Across more than 3,000 global SEO campaigns, Seotonic has seen the same pattern repeat: the teams that protect and grow SEO budgets are the ones that report on business outcomes, not SEO activities. The shift from ranking-focused reporting to revenue-focused reporting is the single highest-impact change most organizations can make, and it doesn’t require changing any of the underlying SEO work.
One area where advanced reporting practice separates strong teams from average ones is attribution modeling. Last-click attribution consistently undervalues organic search’s contribution to conversions, because organic often touches a buyer early in the journey before paid or direct channels close the deal. Multi-touch attribution models, which distribute credit across all touchpoints in the customer journey, give a more accurate picture of what organic search actually contributes. The gap between last-click and position-based attribution can be substantial, and presenting both models to stakeholders, with a clear explanation of the difference, builds credibility rather than confusion.
Metric conflict resolution is another area where discipline pays off. When Google Search Console, GA4, and a rank tracker report different numbers for the same metric, the answer isn’t to pick the most favorable figure. It’s to implement a formal reconciliation process: use GSC for Google’s view of visibility, GA4 for on-site behavior and conversions, and rank trackers for competitive positioning. Document which tool is authoritative for which metric and apply that consistently across every report.
Publishing proprietary data is one of the most defensible ways to earn AI citations and organic visibility simultaneously. Top-ranking pages typically contain only four unique data points on average. A page with more original, structured findings outperforms generic content in both traditional search and AI-driven results. For SEO teams, this means that the data you collect across campaigns isn’t just useful for internal reporting. It’s a competitive asset worth publishing.
Seotonic’s approach to AI-driven SEO strategy incorporates AI visibility metrics directly into reporting frameworks, tracking branded query volume trends and AI referral traffic from platforms like Perplexity alongside traditional organic metrics. Framing AI citations as brand impression reach, similar to how you’d report billboard exposure, gives executives a useful mental model without overstating the commercial value of a citation that didn’t convert.
Tailored dashboards for different teams, built in Google Looker Studio and refreshed automatically, eliminate the weekly manual export cycle and keep every stakeholder working from the same data. That consistency is what turns reporting from a monthly obligation into a genuine decision-making tool.
Key Takeaways
Data-driven SEO reporting connects organic search performance directly to business outcomes, making it the foundation for protecting and growing SEO investment.
| Point | Details |
|---|---|
| Lead with business outcomes | Organic revenue and lead volume belong at the top of every stakeholder report, not rankings. |
| Match format to audience | Executives need quarterly one-page summaries; operational teams need weekly dashboards with technical detail. |
| Automate data collection | Automated pulls from GA4, Google Search Console, and CRM platforms reduce errors and free analysts for interpretation. |
| Resolve metric conflicts formally | When GSC and GA4 disagree, use GSC for visibility diagnostics and GA4 for conversion analysis, consistently. |
| Use multi-touch attribution | Last-click models undervalue organic search; position-based or data-driven attribution captures the full contribution. |
FAQ
What is the role of data in SEO reporting?
Data in SEO reporting connects organic search performance to business outcomes like revenue, leads, and pipeline. It provides the evidence base for strategic recommendations, tracks progress against KPIs, and justifies ongoing SEO investment to stakeholders.
What is the 80/20 rule in SEO?
Effective SEO performance analysis identifies your highest-performing pages, keywords, and content assets so you can prioritize them in both strategy and reporting.
What are the four pillars of SEO?
The four pillars are technical SEO, on-page optimization, content, and authority building through backlinks. In reporting terms, these map to the four KPI tiers: site health, efficiency, visibility, and business outcomes.
What are the three C’s of SEO?
The three C’s are content, code, and credibility. Content covers what you publish, code covers technical site health, and credibility covers the authority signals like backlinks and brand mentions that search engines use to evaluate trustworthiness.
Is SEO dead or evolving in 2026?
SEO is evolving, not dying. Google remains the dominant player in search, and organic search continues to drive a significant portion of website traffic across multiple industries. The shift toward AI-driven search results changes how visibility is measured, but the underlying need to connect organic performance to business outcomes remains unchanged.